What a data table teaches you about trust
Nobody trusts a number they cannot trace.
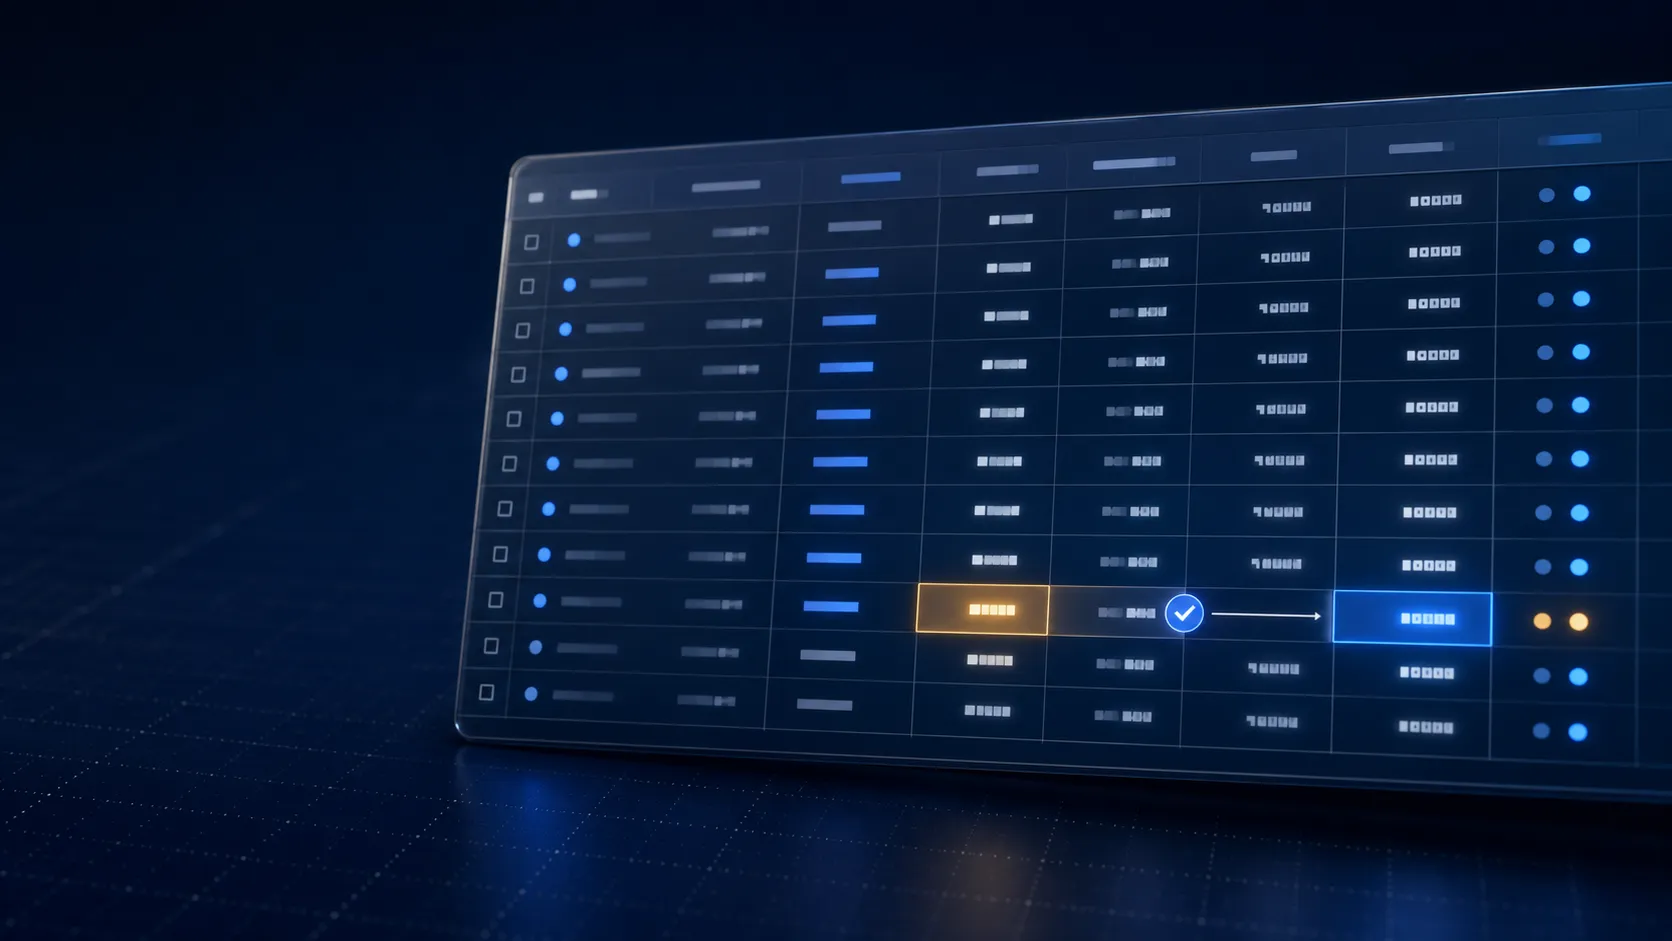
The first enterprise dashboard I shipped had forty-one metrics on it. I was proud of the density. Six weeks later I watched an analyst export the whole thing to a spreadsheet, delete thirty-eight columns, and rebuild the three she needed by hand. She did it every Monday morning, for as long as anyone could remember.
She was not working around a missing feature. She was working around a missing explanation. Every number on that screen was correct and not one of them said where it came from.
Provenance is an interface problem
We tend to treat data lineage as a backend concern, something the pipeline knows and the interface summarises. But the moment a number carries a consequence, the question stops being what is it and becomes who computed it, from what, and when.
The most important column in an enterprise table is usually the one nobody asked for.
In the profiling tool we added a quiet timestamp and a source chip to every computed cell. It tested badly in the first round. People said it looked cluttered. It tested extremely well in the second, once we had sat with them long enough to see what they did with it.
What I would do differently
Start with the export. If the first thing a user does with your table is take the data somewhere else, that destination is the real interface and the table is a slow download button. Design the destination, then work backwards.
Forty-one metrics became nine, and each of the nine carries a line of provenance nobody reads until the one week they need it desperately. That week is the whole point.
If this was worth your time, leave it some love.